Map of Zones
This is an exploration/demo of Map of Zones an innovative IBC/Cosmos Explorer.
This is an exploration/demo of Map of Zones by Curious Cosmonaut Reserarch.
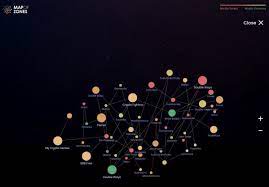
MapOfZones - is an explorer of the Cosmos network (https://mapofzones.com/home?columnKey=ibcVolume&period=24h)
By default, the explorer shows you a visual overview of the IBC network volume of all of Cosmos over the last 24 hours and can be changed to 7 days and 30 days as well.

From there you can change IBC Volume to total transactions, IBC transfers, and DAUs. DAUs track the unique amount of addresses on each chain.
These are great tools to track the activity of Cosmos and see its overall growth as well as the growth/contraction of any one given part of the Cosmsos Network.

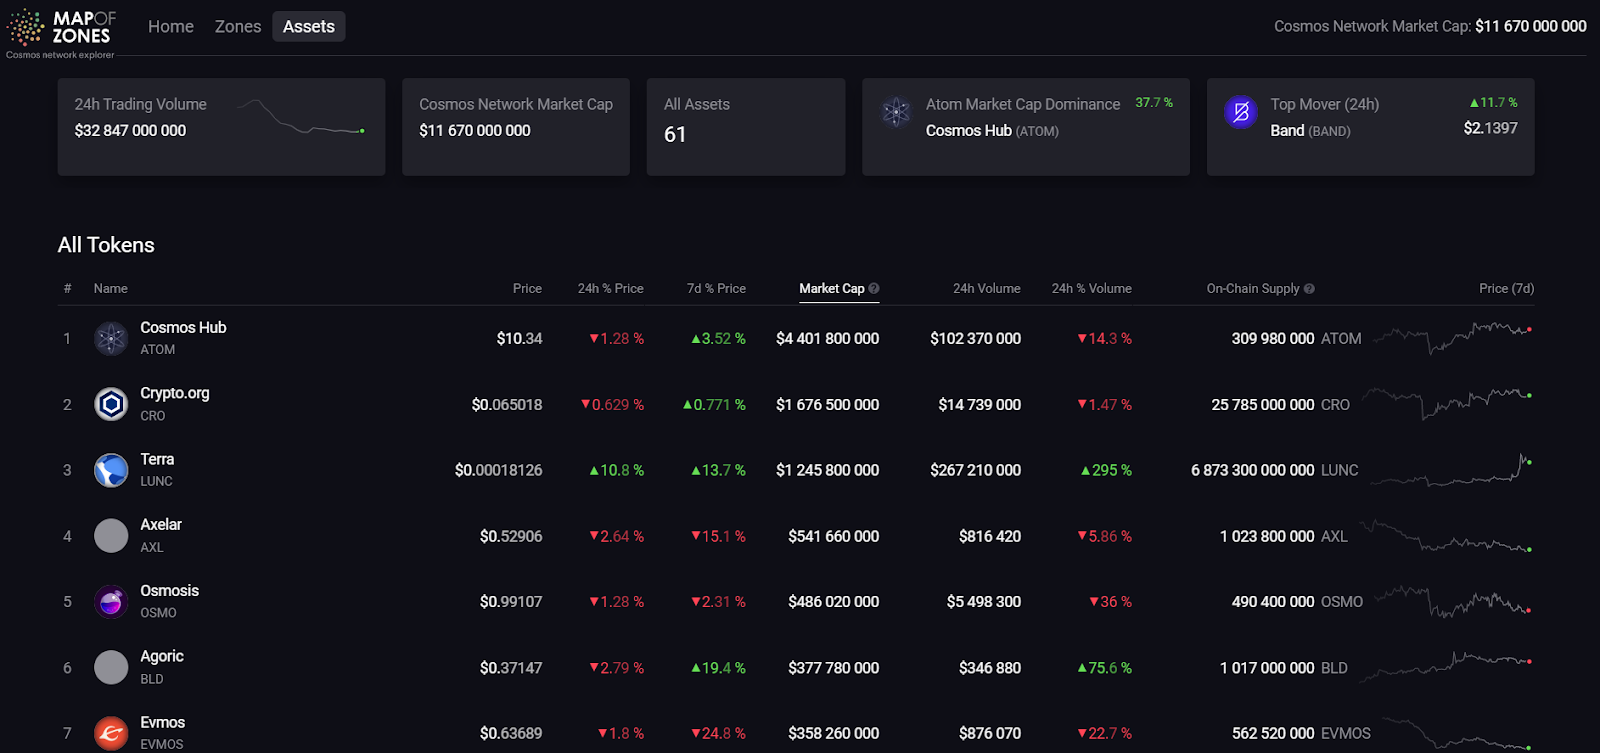
From there you can also pull interesting things like biggest volume pairs in Cosmos, most active IBC pairs, total active IBC channels, total channels by each chain, IBC Volume in and out and many more metrics.
How can you use this?
Some of the best ways are to see overall network trends and health and here are some examples:
- What pools have the deepest liquidity? - 24 hour pools
- Where do assets flow through? Channel activity and IBC in/out
- This can also show trends of where assets may not be leaving the platform.
- How much activity is happening on a chain? - total transactions
- This can also show trends of where a lot of activity may be happening on a chain without needing as much IBC activity as well. For example Stride has a lot more of IBC per transaction then say ATOM.
- Is the Cosmos ecosystem growing organically?
- Number of chains doing IBC, IBC volume, DAU - actual wallets coming online, transactions on DEXs and so on can show real growth/contraction places instead of focusing on market caps and asset prices.
- Mainly Sends/Receives
- This takes more analysis but one can thing about how/why a chain is receiving or sending more. Is it a better platform for entering the Cosmos ecosystem and then going elsewhere like ATOM and maybe CRO?
- Is there a reason such as sell pressure that assets are leaving the chain?
- If two similar products like DEXs or DeFi are experiencing different send/receive trends why? Maybe users are leaving a platform for other platforms for some reason.
These are just some examples of the many ways you can use this amazing tool.